 PmaControl
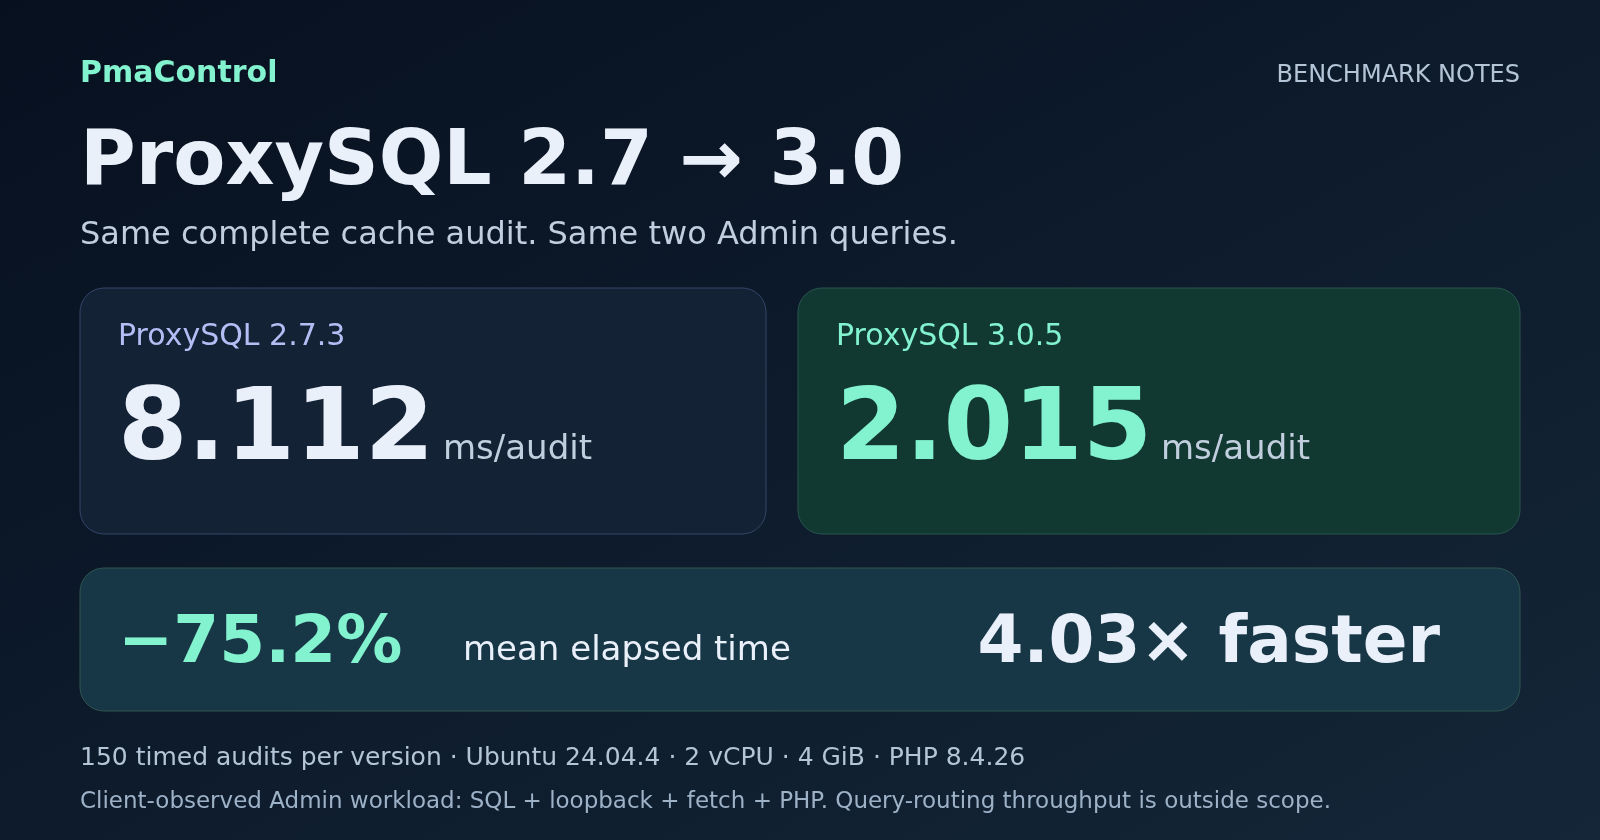
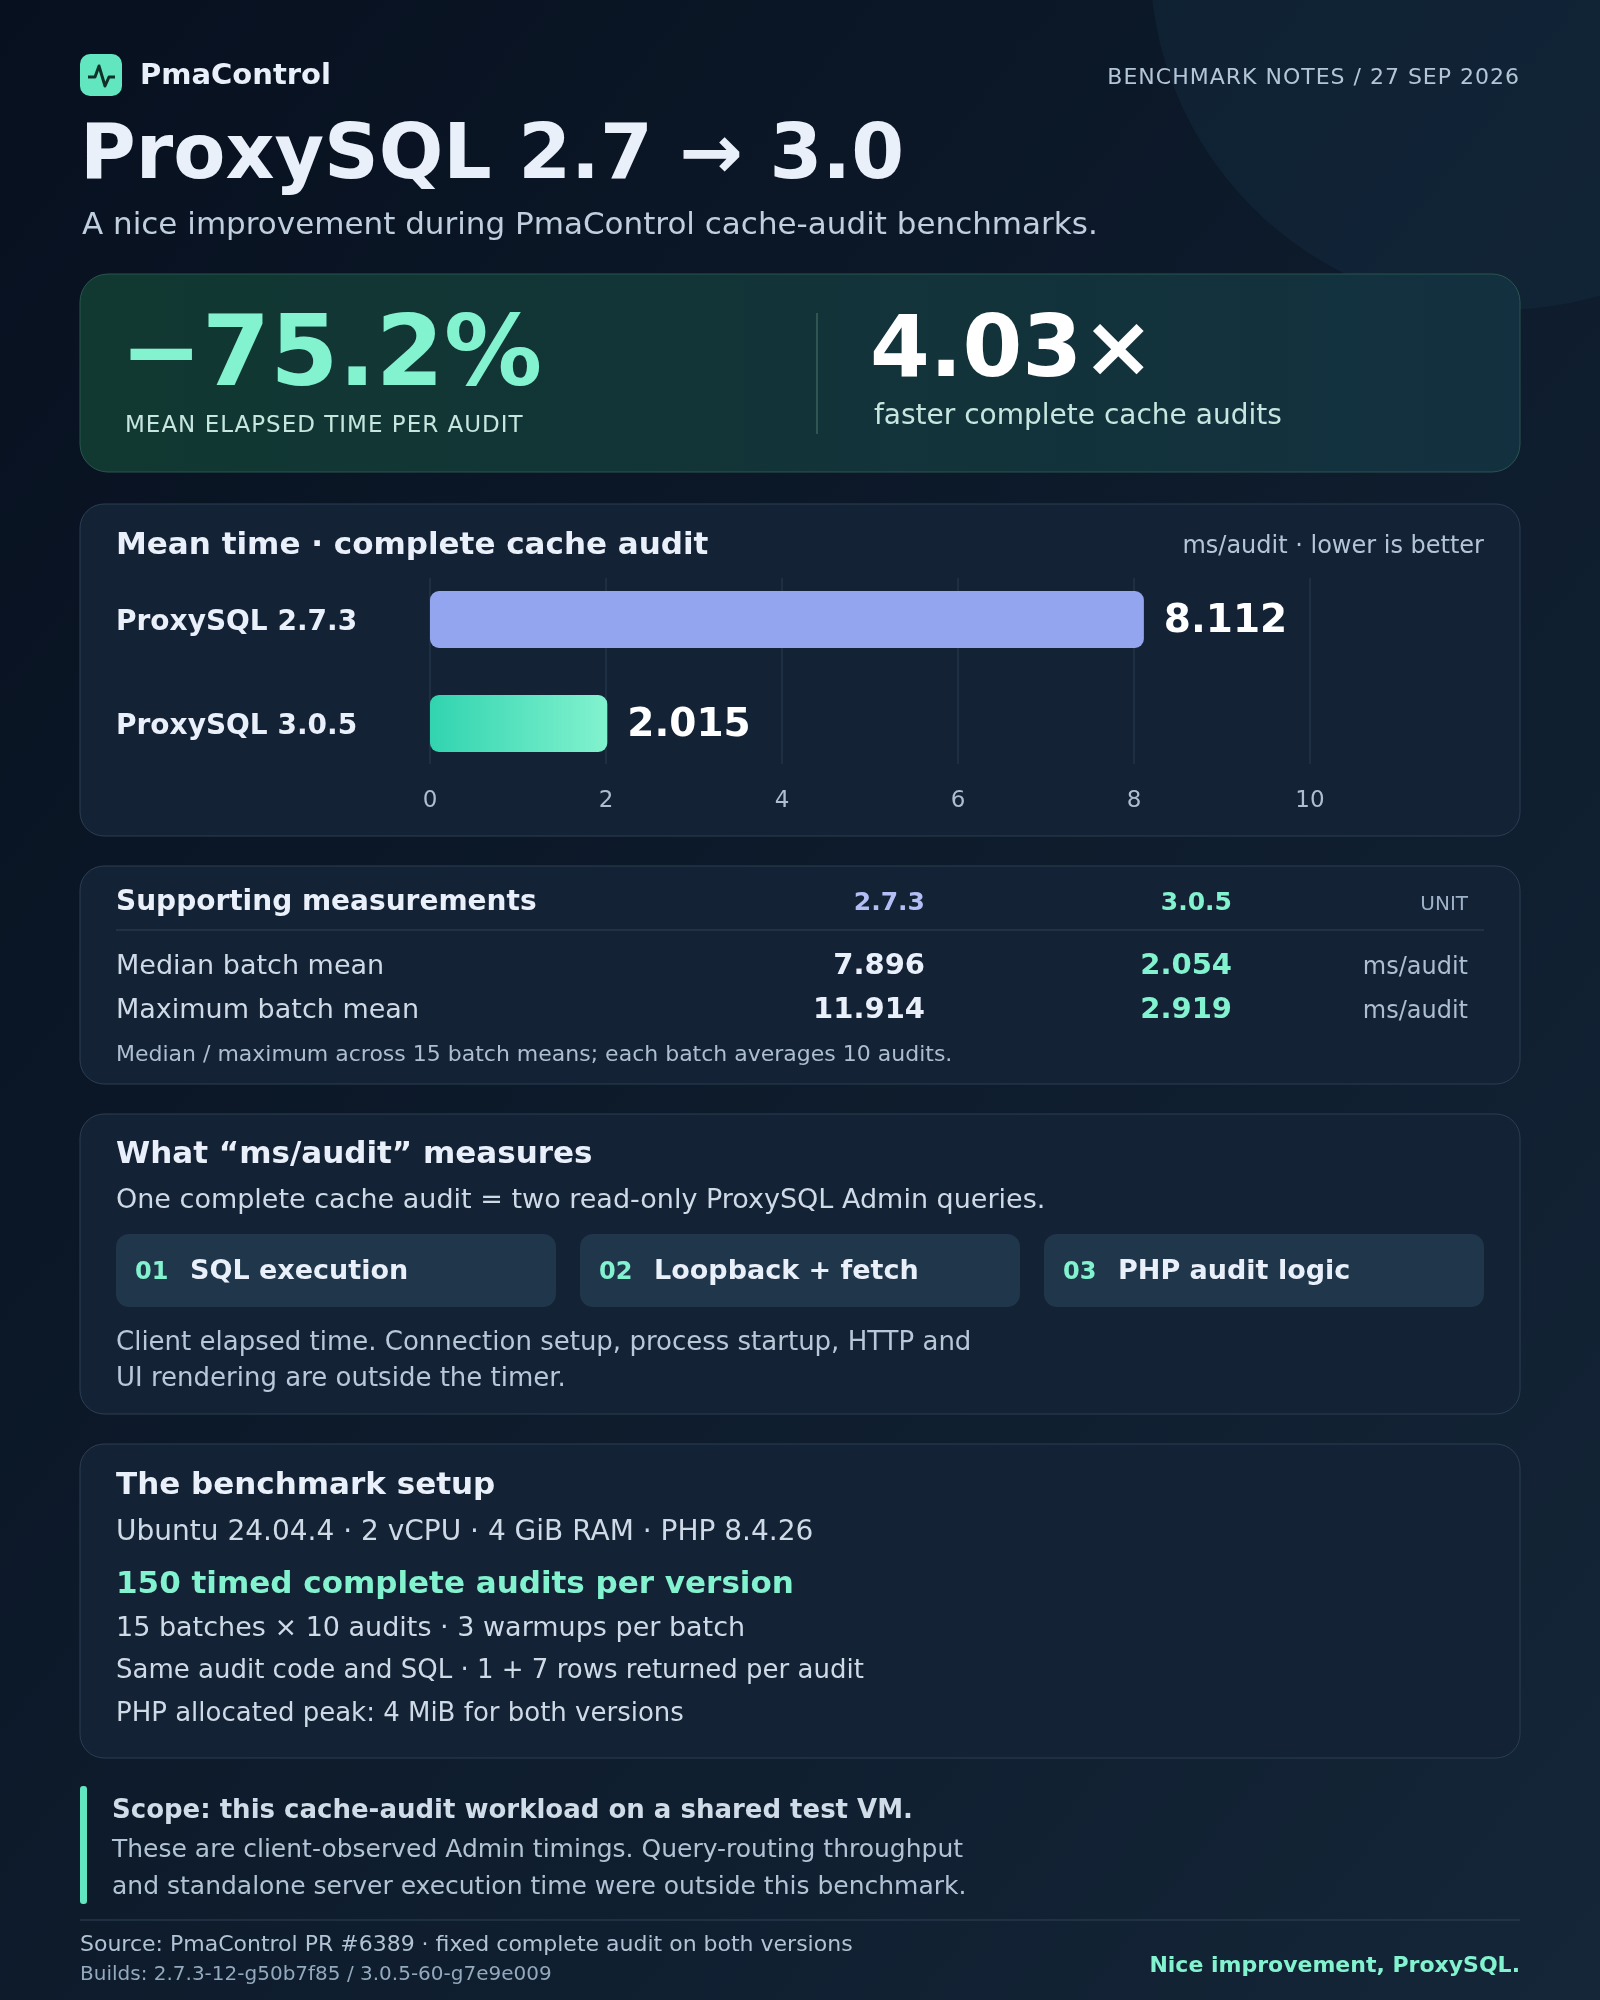
A nice improvement spotted during PmaControl benchmarks: the same complete cache check went from 8.112 to 2.015 milliseconds on average between the tested ProxySQL 2.7.3 and 3.0.5 builds. That is 75.16% less elapsed time, or a 4.03× reduction in mean duration.
Here are the numbers, their definition, the queries and the method behind that result. The workload is PmaControl’s cache-effectiveness check, executed through the ProxySQL Admin interface.
The results, with the same work performed
| Metric | ProxySQL 2.7.3 | ProxySQL 3.0.5 | Time reduction |
|---|---|---|---|
| Mean, ms/audit | 8.112204 | 2.014760 | 75.16 % |
| Median of batch means, ms/audit | 7.895812 | 2.053810 | 73.99 % |
| Maximum batch mean, ms/audit | 11.914402 | 2.919234 | 75.50 % |
| PHP allocated peak, MiB | 4 | 4 | unchanged |
The timings in the table use ms/audit, except for memory. The median and maximum are computed over 15 means of batches containing 10 audits. The maximum is therefore neither the slowest individual call nor a latency percentile. The data files preserve the original precision; the infographic rounds durations to three decimal places.
The 4 MiB PHP peak describes memory allocated to the PHP process. It does not measure ProxySQL server memory.
What “ms/audit” means
An audit here means one complete call to QueryCacheEffectiveness::run(), rather than every check performed for a server. It runs two read-only SELECTs: the first reads active cache rules and their match counters; the second reads cache counters and the configured size. The fixture returns one row, then seven rows.
The timer surrounds the PHP check. It includes native SQL execution, loopback communication, result fetching and PmaControl processing. Initial connection setup, PHP process startup, HTTP and UI rendering are outside the timing window. These are client-observed durations; they do not isolate execution time inside ProxySQL.
The two queries below are formatted for readability. Their logic is identical on both versions.
SELECT r.rule_id, r.cache_ttl, r.digest,
       r.match_digest, r.match_pattern,
       COALESCE(h.hits, 0) AS hits
FROM runtime_mysql_query_rules r
LEFT JOIN stats_mysql_query_rules h
       ON h.rule_id = r.rule_id
WHERE r.active = 1 AND r.cache_ttl > 0
ORDER BY r.rule_id;
SELECT Variable_Name AS name, Variable_Value AS value
FROM stats_mysql_global
WHERE Variable_Name IN (
'Query_Cache_count_GET', 'Query_Cache_count_GET_OK',
'Query_Cache_count_SET', 'Query_Cache_Memory_bytes',
'Query_Cache_Entries', 'Query_Cache_Purged'
)
UNION ALL
SELECT variable_name, variable_value
FROM global_variables
WHERE variable_name = 'mysql-query_cache_size_MB';The stats_mysql_query_rules.hits field counts rule matches, not cache hits attributable to that rule. Cache counters are cumulative and cannot, on their own, establish a recent hit rate. The mysql-query_cache_size_MB value read from MAIN is a configured purge target, not a hard limit; its runtime value is not verified by this check.
The benchmark method
The source benchmark used a shared test VM running Ubuntu 24.04.4 LTS, with 2 vCPU, 4 GiB RAM and PHP 8.4.26. Connections used loopback and the following native ProxySQL builds:
2.7.3-12-g50b7f85for the 2.7 series;3.0.5-60-g7e9e009for the 3.0 series.
For each version, the published selection contains 15 batches of 10 timed audits, after 3 warmup calls per batch: 150 complete audits per version, 300 in total and 600 SELECTs. The PHP helper and SQL strings are identical; the helper hash and returned row counts are checked in each batch and call.
The original experiment alternated the old and corrected PmaControl variants in 15 AB/BA pairs, using a separate PHP process per variant. This publication selects only the corrected variant. Within each process, ProxySQL 2.7.3 ran before 3.0.5: ProxySQL version order was not alternated. The 600 calls and 900 SELECTs in the entire experiment, including the old variant, are not the sample counts for the comparison shown here.
Why we use the complete check
The benchmark accompanied a correctness fix: a valid rule with signed identifier rule_id=-1 and a 5,000 ms TTL previously stopped the check after the first read. It incorrectly reported unavailable statistics, and the second query was never reached.
Comparing that incomplete return with the corrected check would compare different amounts of work. We therefore use the same corrected helper on both ProxySQL versions, with both reads and complete observations. The published gain compares the ProxySQL builds in this scenario; it is not attributed to PmaControl’s validation fix. Existing measurements were rechecked; no new benchmark was run for this article.
What this improvement tells us
In this environment, the mean, median of batch means and maximum batch mean are all lower with the tested 3.0 build. Peak PHP allocated memory is unchanged. This is a measurable improvement in a monitoring workload.
The result concerns a shared VM, small result sets and one specific check. It does not certify application-query throughput, frontend routing latency or the same gain under high concurrency. It does not isolate server prepare/step/copy/finalize phases, demonstrate a sub-1 ms SQL budget, or assess production capacity or durability. No confidence interval is established, and version order is fixed.
Within that scope, the complete cache check took about one quarter of the mean time in this measurement. Nice improvement, ProxySQL!
Recalculate the results
The public data contains the 30 selected batches, 300 individual durations, result cardinalities and method metadata. Internal paths and diagnostic findings have been removed; timings are unchanged. The Python script uses only the standard library and recalculates the table; it does not rerun the benchmark.
Time reduction is 100 × (1 − time_3.0 / time_2.7); the ratio is time_2.7 / time_3.0. Every batch has the same size. The hash below identifies the helper actually loaded; the commit is the PR revision containing that implementation.
curl -fsSLO https://pmacontrol.com/downloads/proxysql-2.7-vs-3.0/benchmark-data.json
curl -fsSLO https://pmacontrol.com/downloads/proxysql-2.7-vs-3.0/analyze.py
python3 analyze.py benchmark-data.json
PmaControl revision:
b4e7b4c6ca72cf27077ddbdb1f2c89af05800b5a
QueryCacheEffectiveness helper SHA-256:
c47a169935f665259554bd0fbaa85e90af9cbcd3983bf7ad3548e2caaf63d4dcGraphics, sharing and sources
- Complete infographic as PNG, 1600 × 2000
- Editable SVG source with all elements included
- Benchmark data as JSON
- Python recalculation script
- English LinkedIn post
- Graphics archive with generation scripts

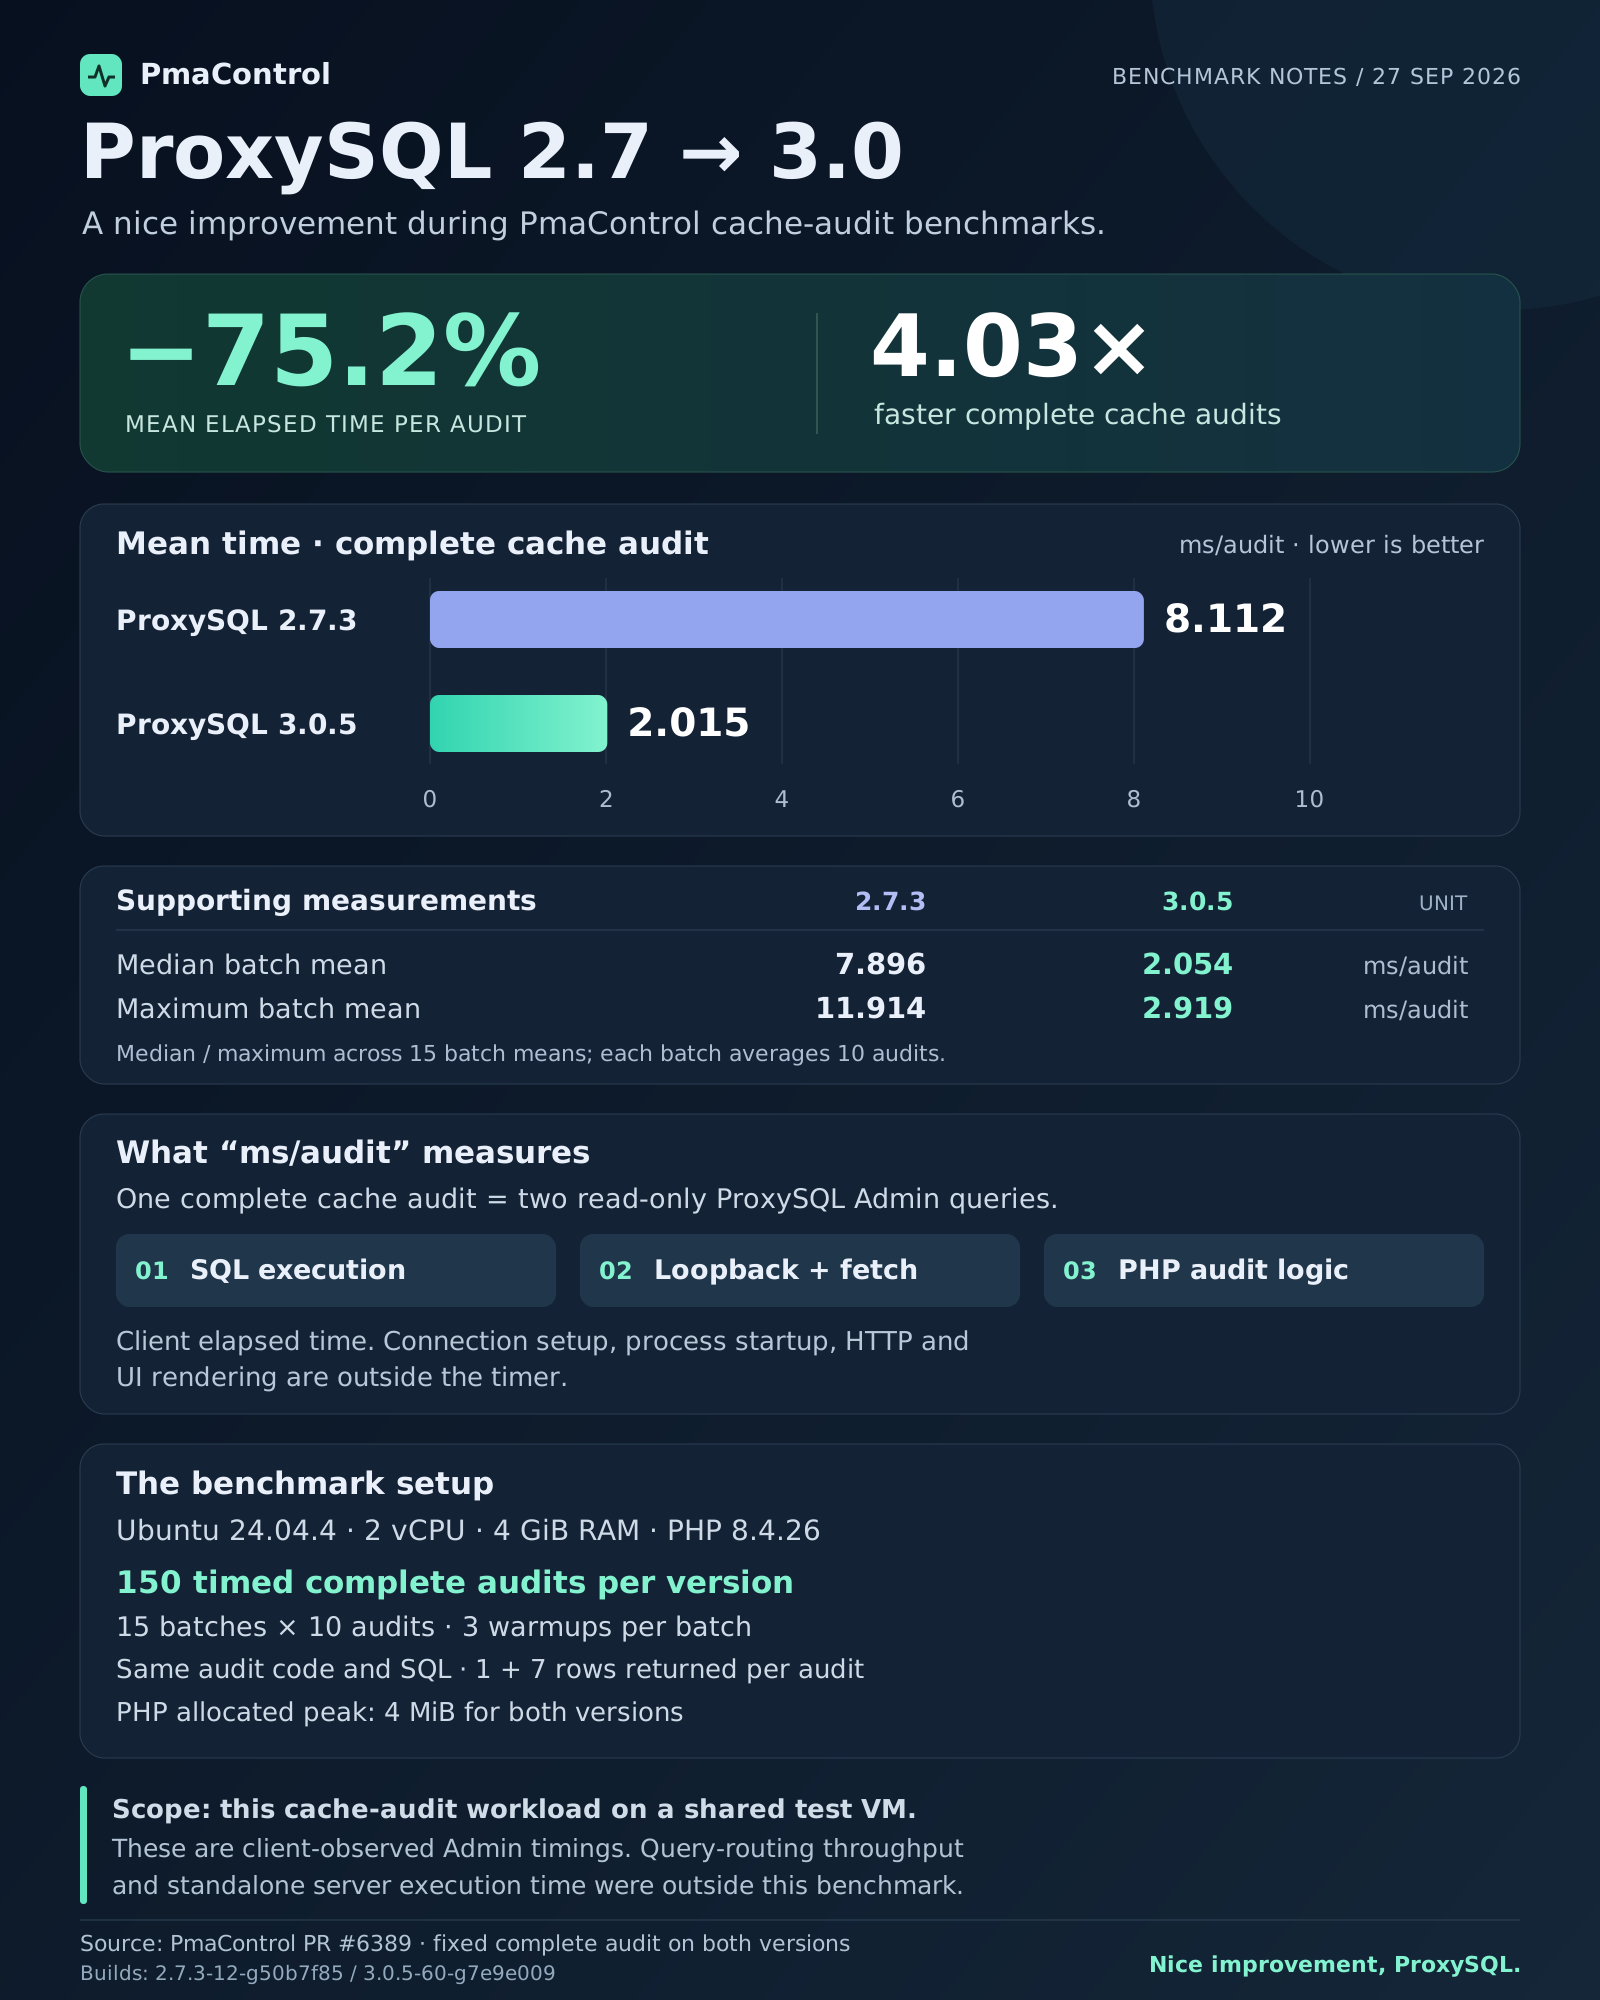
The graphic is in English for sharing; this article includes all of its explanations and measurements. The page’s PDF button also exports the article with its images.
Original work: PmaControl PR #6389 and communication issue #6390. Those Forgejo references require repository access; the downloads above are public.
Comments (0)
No comments yet.
Leave a comment